We sometimes miss the bigger picture, when we focus solely on the U.S. economy. This certainly seemed like the case in 2011, when precious metals corrected sharply in the second half of the year, despite a new U.S. easing effort in the form of ‘operation twist’. In particular, we can take our eye off the Chinese economy, which I shall examine below by looking at the Chinese yield curve.
The fall of precious metal prices towards the end of last year is a tough one to explain. I had been keeping a close eye on the U.S. economy through the lens of the U.S. yield curve. This seemed perfectly logical, given that precious metal prices are priced in U.S. dollars.

- USA Yield Curve: 2006-2012
The shape of the U.S. yield curve was suggesting that monetary policy was still very loose in the United States, as it had been since late 2008. This should have been an excellent environment for precious metal prices and yet we had a serious correction in the second half of 2011. So why was this?
I was interested to hear this interview of precious metal dealer Robert Mish, talking to Chris Martenson:
He suggested that there were many more sellers of precious metals in the United States than buyers. The surplus was being bought by investors in the Far East, who Mish suggested were willing to fly into the United States on day trips, in order to get hold of the metals. We can miss a trick by fixating so heavily on the United States, to the exclusion of the Chinese economy and Chinese yield curve. So let’s correct this issue now.
Chinese CPI

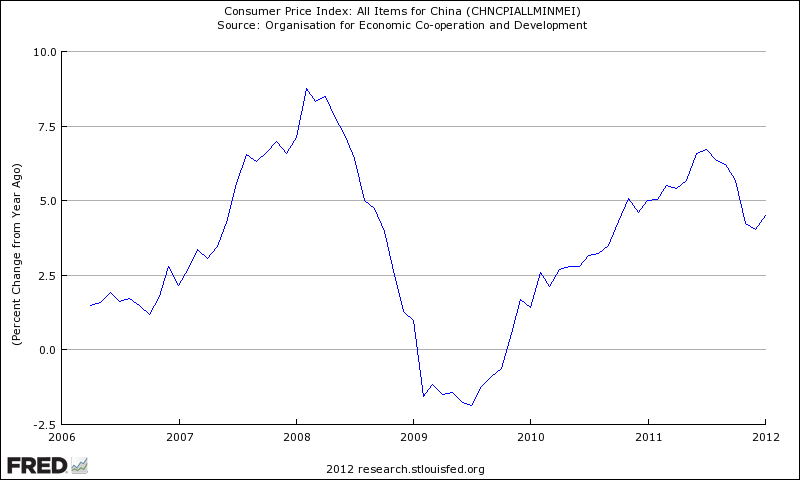
Chinese CPI: 2006-2012
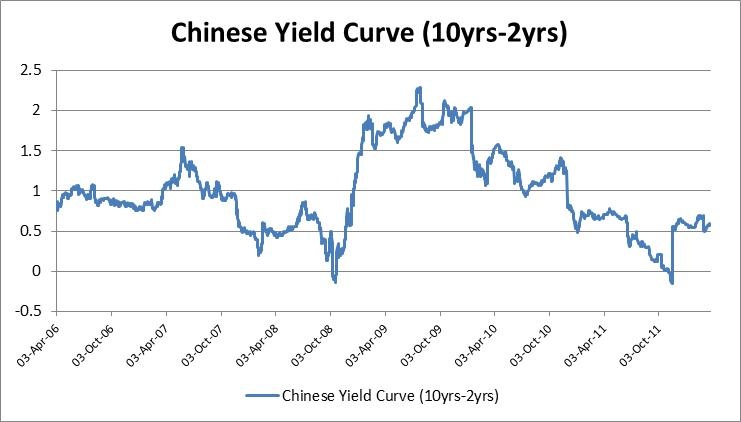
China suffered a large increase in its CPI measure from mid-2009. CPI peaked at 6.7% in July 2011 and then started to decline. The government responded to the increase in CPI by raising Chinese interest rates and reserve requirements. We see that the Chinese authorities raised short term rates to such an extent that the Chinese yield curve had completely flattened by late-2011. By the end of 2011, Chinese CPI began to move downwards and the authorities commenced tentative easing measures.
Chinese Yield Curve

Chinese Yield Curve (10yrs-2yrs): 2006-2012
The flattening out of the Chinese yield curve in 2011 coincided with a relatively poor year for the cyclical precious metals: silver and platinum group metals and a lacklustre second half for gold.
Conclusion
Given China’s role as a major demand source for both metals and energy, it is not surprising to see the Chinese yield curve playing a role in metal prices. Now that Chinese CPI is easing, we can expect more interest rate cuts this year. This is likely to have a highly stimulatory impact on precious metal prices and commodity prices in general.